
About Course
Statistics consists of ways to analyze data and make informed decisions. However, to be able to deploy statistical methods appropriately and properly, one needs to have a firm understanding of the available statistical methodologies and continuously build on the basic information acquired from classes like this one.
Therefore, statistics is a powerful tool needed by business managers, engineers, political scientists, medical and biological researchers in the data-driven world of today. Recent and evolving advances in information technology have expanded the role of data and big data, in all areas of endeavor, especially in the business, marketing, and medicine, among others.
Huge volumes of the available data cannot be utilized properly unless they are summarized and visualized effectively. Business analytics provides methodologies that enable decision makers to effectively use large data sets that would not be practical by any other means. Those who are familiar with visualization tools like Tableau routinely encounter analysis that are statistics-based.
This course teaches the basics of data analysis and summary statistics, visualization of data, pivot table, probabilities, hypothesis testing, ANOVA, and regression analysis. For instance, regression models may be used as basic tools of forecasting sales, costs, spread of diseases, among other uses.
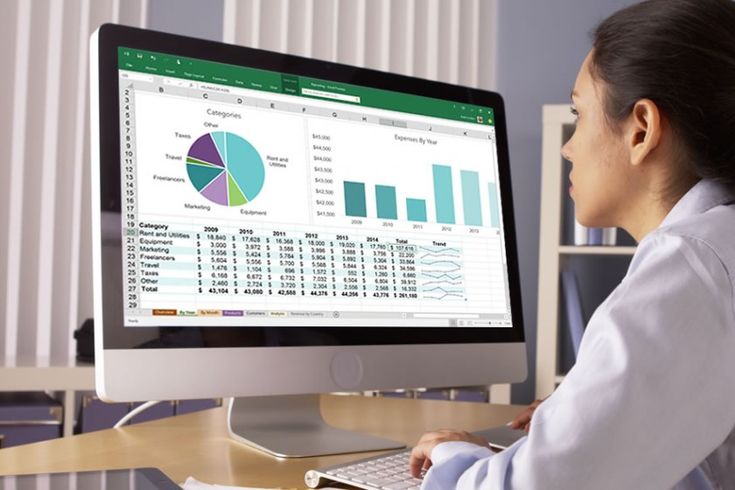
The tool we use is MS Excel. In most situations, once data are extracted using other tools such as SQL, Excel becomes the main platform for analysis.
Course Content
Introduction
-
The Course Textbook
-
Introduction to random samples_1
-
Introduction to random samples_2
-
Introduction to random samples_3
-
Introduction to random samples_4
-
Introduction to regression_1
Chapter 2 -Managing and Visualizing Data
Chapter 3- Numeric Descriptive Measures of Data
Section 4: Chapter 4-Probability Theory
Section 5: Chapter 5- Discrete Probability Distributions
Section 6: Chapter 6- Normal and Uniform Probability distributions
Section 7: Chapter 7- Distribution of Sample Means and Proportions
Section 8: Chapter 8- Confidence Intervals for Population Means and Proportions
Section 9: Chapter 9- Testing Hypotheses For Population Means and Proportions
Section 10: Chapter 10- Testing Equality of Two means, Proportions, Variances
Section 11: Chapter 11- Testing Multiple Population Means and Variances, ANOVA
Section 12: Chapter 12- Simple Linear Regression
Section 13: Chapter 13- Multi Variable Regression
Student Ratings & Reviews
